Pressure, Precipitation, and Possibility: The Amateur Weather Networks Charting Climate Where Official Sensors Cannot Reach
A Gap in the Official Record
The National Weather Service maintains approximately 900 surface observation stations across the contiguous United States. For a nation of more than 3.8 million square miles, that network—however professionally maintained—leaves vast stretches of territory without direct measurement. In densely settled urban areas, the problem is not one of empty geography but of compressed complexity: two city blocks can differ in temperature by several degrees, in wind exposure by a significant margin, and in rainfall accumulation by a measurable amount during a single storm event. Official instruments, typically sited at airports or municipal facilities, capture none of this variation.
Into that gap, thousands of ordinary residents have stepped with consumer-grade weather stations, shared data platforms, and a collective commitment to local observation that mirrors the collaborative spirit driving citizen science across many disciplines. The result is an expanding hyperlocal climate record that researchers, urban planners, and community advocates are beginning to take seriously.
The Instruments in the Yard
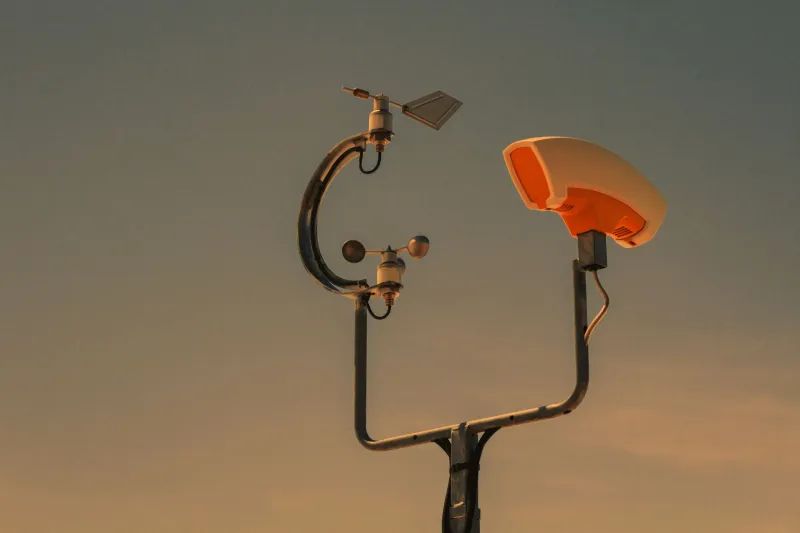
A personal weather station today is a remarkably capable device. For a few hundred dollars, a homeowner can install a unit that measures temperature, relative humidity, barometric pressure, wind speed and direction, rainfall accumulation, and solar radiation—then transmits all of it automatically to the internet at intervals of a few minutes. Platforms such as Weather Underground's Personal Weather Station network, the Community Collaborative Rain, Hail and Snow Network (CoCoRaHS), and Citizen Weather Observer Program aggregate these feeds into continuously updated maps accessible to anyone.
CoCoRaHS alone has enrolled more than 130,000 volunteers across all fifty states. Participants receive standardized rain gauges, training materials, and access to a reporting portal where daily precipitation totals are entered and immediately incorporated into a shared dataset. The network's data has been cited in peer-reviewed hydrology research, used by the National Weather Service to calibrate radar estimates, and consulted by emergency managers assessing flood risk after major storm events.
The volunteers themselves range from retired engineers to elementary school teachers to farmers concerned about irrigation scheduling. What unites them is the habit of careful, consistent observation—the same discipline that defines rigorous scientific practice at any scale.
What the Numbers Reveal
When enough stations are operating within a single metropolitan area, patterns emerge that no single official instrument could detect. Urban heat island research has benefited enormously from dense citizen networks. In cities including Phoenix, Houston, and Baltimore, researchers working with volunteer-collected data have documented temperature differentials of five degrees Fahrenheit or more between heavily paved commercial corridors and adjacent residential neighborhoods with mature tree canopy—differentials with direct implications for public health, energy consumption, and the lived experience of residents who cannot afford air conditioning.
Flood risk mapping is another area where hyperlocal data is proving its value. Official rainfall estimates derived from radar are averaged across grid cells that may span several square miles. During intense convective storms—the fast-moving, localized downpours increasingly common in a warming climate—actual rainfall totals can vary dramatically within a single neighborhood. Citizen rain gauges have documented events in which one street received three inches of rain while a parallel street half a mile away received under one inch, a disparity with serious consequences for stormwater management and basement flooding.
Seasonal phenology offers a third dimension. When station operators record the dates of first frost, last freeze, and the onset of extreme heat, year over year, they are building a neighborhood-scale climate chronology that complements the broader regional records maintained by official agencies. Over a decade or more, these personal logs become genuine historical documents.
The Learning Infrastructure Behind the Data
Collecting weather data is only part of what these networks accomplish. The training materials, community forums, and regional coordinators that organizations such as CoCoRaHS maintain constitute a distributed educational infrastructure—one that teaches participants the principles of measurement accuracy, data quality control, and scientific communication. Volunteers learn why instrument siting matters, how to identify and report anomalous readings, and how their local observations connect to larger atmospheric systems.
Some networks have formalized this educational dimension by partnering with K–12 schools. Students who install and maintain classroom weather stations gain direct experience with data collection methodology, statistical reasoning, and environmental monitoring—skills that support scientific literacy regardless of the career paths they eventually pursue. Several state climatologist offices have developed curriculum guides built around citizen weather data, explicitly framing student observers as contributors to a genuine scientific record.
Challenges of Quality and Continuity
The scientific community has engaged with citizen weather data thoughtfully, neither dismissing it wholesale nor accepting it uncritically. The most significant challenge is instrument siting: a station placed too close to a paved driveway, an air conditioning exhaust vent, or a south-facing wall will produce readings that reflect local artificial influences rather than ambient atmospheric conditions. Crowdsourced networks address this through siting guidelines, quality flags applied to suspicious readings, and algorithms that identify outliers relative to neighboring stations.
Continuity presents a related concern. Official observation networks operate under institutional mandates that ensure long-term data collection regardless of personnel changes. Citizen networks depend on individual motivation, and stations go offline when participants move, lose interest, or face equipment failures. Building redundancy into the network—ensuring that no area depends on a single volunteer—is an ongoing organizational challenge that regional coordinators actively manage.
Despite these limitations, atmospheric scientists increasingly regard dense citizen networks as a complement to, rather than a substitute for, professional monitoring—a source of spatial resolution that official infrastructure cannot economically replicate.
Neighborhood Knowledge, Community Action
Perhaps the most consequential application of citizen weather data is not scientific but civic. When residents of a low-income neighborhood can demonstrate, with years of documented readings, that their streets are consistently hotter than wealthier areas three miles away—and that the disparity correlates with the absence of street trees and the concentration of impervious surface—they possess an evidence base that transforms advocacy conversations. Data collected by community members, about their own environment, carries a particular authority in public hearings and planning processes.
Several municipal climate adaptation initiatives have begun formally incorporating citizen weather station data into their planning workflows, recognizing that the granularity it provides is essential for designing interventions—cool corridors, expanded tree canopy, permeable pavement—that address inequality as well as climate risk.
The backyard weather station, in this light, is not merely a hobbyist's instrument. It is a node in a collaborative knowledge-production system that is slowly, persistently filling in the map of how climate change is actually experienced, block by block, across the American landscape.